In December of 2014 I was admitted to the University of Maryland Medical Center very late at night with incredible pain. To make a long story short I quickly found myself horizontal under a skilled surgeon's knife (Thank you,
Dr. Guatam Rao, great job, attaboy!). After which I began a very very long road to recovery in the early months of 2015. As an avid outdoorsperson and claustrophobe I found this endeavor to be problematic. In order to pass the time I thought it might be fun to be able to view all the bike trails available in Baltimore City on my little bike-friendly GPS so that I would know where they were as a tooled around the city on my 1984 Raleigh Pursuit. Although I couldn't exactly ride my bike at this time I could mentally pretend to do so with this project.
I set about combining two datasets from Open Baltimore(Sources listed at the bottom of this post). One contained all the bike lanes, signed routes and sharrows and the other had all the dedicated bike trails. As the map layer I created began to take form I was very shocked at what showed up on my mapping software. There were no bike lanes available in West Baltimore and almost no bike lanes available in East Baltimore. In fact, what I found was the majority of the bike infrastructure in the city seemed to be found in the wealthier white neighborhoods. Semi-pleased with my first rudimentary map I added a 2010 Census Layer(choropleth) annotating black population under the bike lanes and then placed an image of the completed map on the
Baltimore Bikemore Facebook Group. I received a tidal wave of angry furious responses from its mainly young white male members. Since I wasn't really working with my A game at that time I neglected to take screen shots of the insults, racism, bullying and shaming I received. Bikemore has since deleted the 122 angry and hate-filled responses directed my way.
At this point I was sure I was on to something, so I continued down the Baltimore bike racism rabbit hole. In May of 2015 I submitted a Maryland Public Information Request to the Baltimore City Department of Transportation(DOT) asking for the locations of all the DOT installed bike racks. Once I received that information I had mapping software geolocate the addresses and the results were even more troubling. The white L emerged like a phoenix. In October of 2016 the city and Bikemore unveiled the first 25 Bikeshare stations, and well, the ugly pattern continued. Regardless of how angry one gets with me I am still merely a messenger. This is about data, data I did not create. I didn't place all the bike racks in the white neighborhoods nor did I avoid placing all the Bikeshare stations in the black neighborhoods. Insulting, bullying, threatening and belittling me won't change the maps. They are what they are. If the city and Bikemore wants productive change it has to stop ignoring this problem, stop conversating about this problem and get out the paint truck and make some lanes where there are no lanes.
I've crafted several visualizations and a lot of people have been requesting them from me lately. I am placing many of them here for everyone's use. If you want to use one of these for your publication please email me at chamgreen102 at gmail.com so you can arrange to credit me for the map.
Bike Lane Maps
Bike Lanes Over Density of Vehicle Owners
Bike Lanes Over Black Population
Bike Lanes and Racks Over White Population
Bike Lanes over 1935 Homeowners Loan Act (HOLC) Residential Security Map Polygons
Bikeshare Maps
First 25 Bikeshare Stations over Populations with No Vehicles Available
First 25 Bikeshare Stations over Black Neighborhoods
First 25 Bikeshare Stations over White Neighborhoods
Bike Rack Maps
DOT Bike Racks Over Populations With No Vehicles Available
DOT Bike Racks Over Black Neighborhoods
DOT Bike Racks Over White Neighborhoods
DOT Bike Racks Over Median Household Income
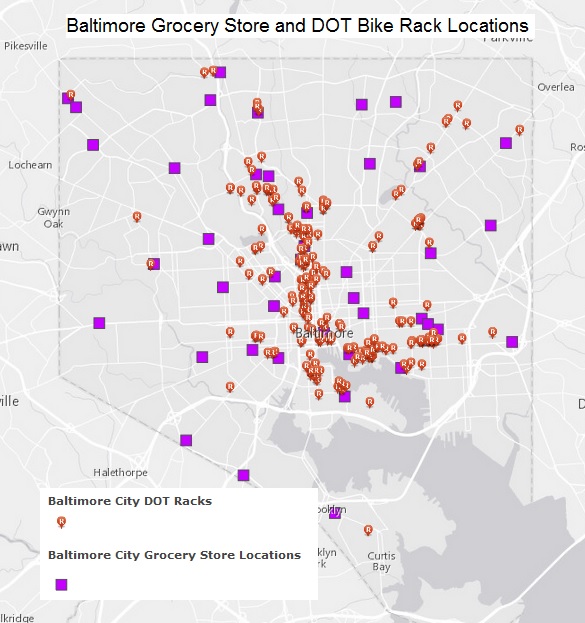
DOT Bike Racks Over Grocery Store Locations
DOT Bike Racks Over Schools
DOT Bike Racks Over Recreation Center Locations
DOT Bike Racks Over Homeless Shelter Locations
DOT Bike Racks Packing Visualization
Data Sources
Datasets of Baltimore Bike Lanes, Routes and Sharrows:
Open Baltimore On-Street Bike Facility Shape File
Dataset of Baltimore Bike Trails:
Open Baltimore Multi-use Trails Shape File
Baltimore DOT Rack Locations provided to me by the Baltimore City Department of Transportation via a Maryland Public Information Request in May of 2015
Addresses of the First 25 BikeShare Locations provided by
the Baltimore Brew
All Census Tract layers were preloaded by members of
ESRI ArcGIS
Locations of schools, shelters, recreation centers and grocery stores may be found in datasets in
OpenBaltimore.
Homeowners Loan Act Polygons created from the
HOLC Residential Security Map provided by the Sheridan Collection, Johns Hopkins University
Special Recognition
I'd like to thank
Taija Thomas and her hard work hosting Hack4Baltimore on May 15-17, 2015 where I forced myself to sit quietly (while in incredible pain) and get the bike routes straightened out so that they would appear seamless on a shape file. I also would like to thank my friend,
Eliot Pearson of AOL, who spent hours helping me with the conversions at the hackathon.
I would like to thank
Tyrone Grandison for hosting Hack For Change and Social Justice, July 16-18, 2015, which is where I made most of the visualizations for the bike racks (while in slightly less pain). 50 of us or so spent three days holed up in a room at the University of Baltimore working on our projects with Artscape going on right out the window. So close yet so far!
I'd also like to thank Freddie Gray who gave his life for the cause. Without him there would have been no hackathons and this project may never have been completed.